The College Readiness of ACT-tested High School Graduates
As a national leader in assessment, research, and data, ACT releases its annual snapshot of the 2021 ACT-tested graduating class.
Use the data visualization tool and resources below to examine students’ college and career readiness relative to the ACT College
Readiness Standards and Benchmarks.
U.S. High School Graduating Class Data
This cohort reflects the first graduating class to experience the effects of the COVID-19 pandemic on their learning experience. ACT puts forth this data, in addition to our extensive COVID-19 related research, to ensure that school systems and states can make informed decisions that will improve outcomes for their students and families. ACT uses a holistic view and our consistent and reliable historical information to provide greater context and visibility as educators make critical decisions for future cohorts of students.
Highlights From This Year’s Data
- Approximately 1.3 million students in the U.S. high school graduating class of 2021 took the ACT test, an estimated 35 percent of graduates nationwide.
- The national average Composite score for the graduating class of 2021 is 20.3, down from 20.6 for the graduating class of 2020.
- Thirty-two percent of the ACT-tested graduating class took the ACT more than once, as compared to 41 percent for the 2020 cohort.
- Students in this class who tested more than once received an ACT Superscore, which reflected their best subject test scores across multiple test attempts. The average ACT Superscore for students testing multiple times is 24.2.
- Thirty-six percent of ACT-tested graduates in the class of 2021 met at least three out of four ACT College Readiness Benchmarks (English, reading, math, and science).
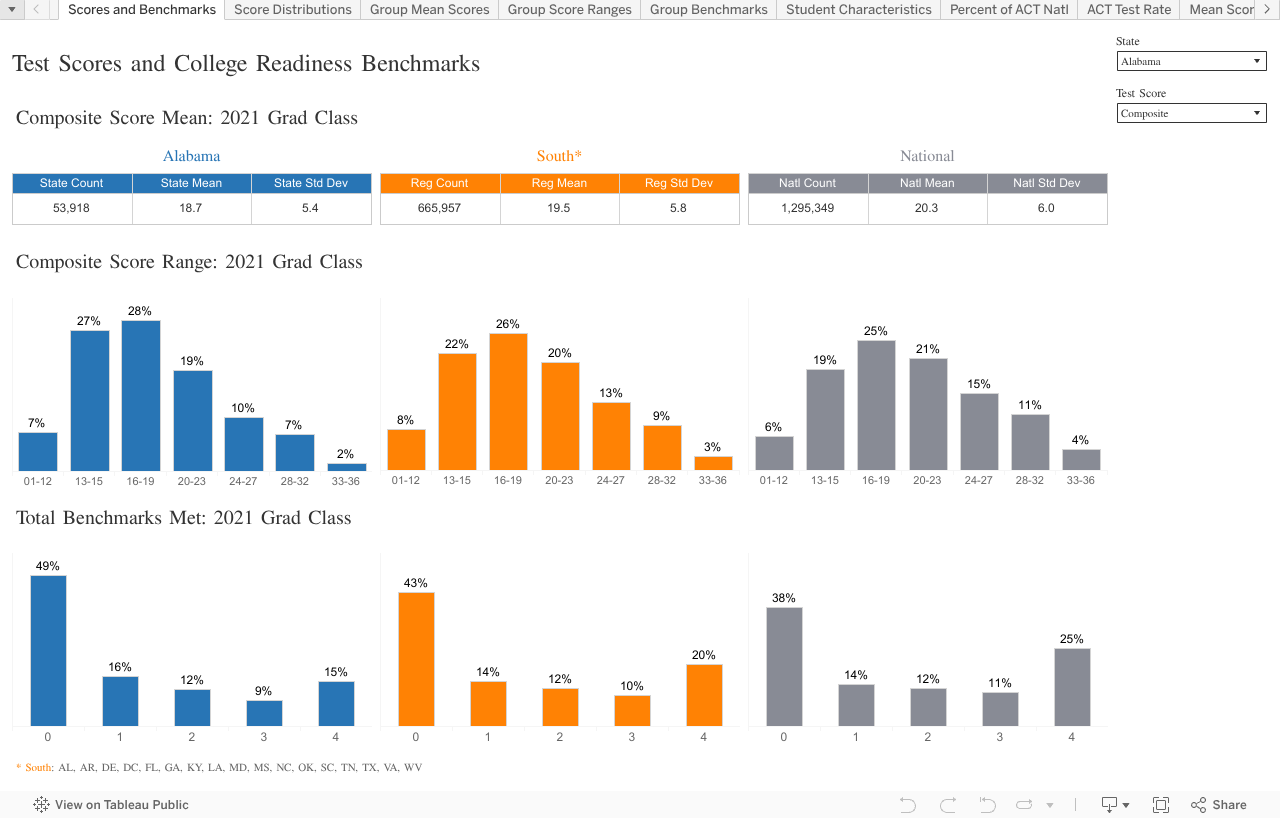
Data Visualization Tool
The visualization tool below allows users to view multiple measures of college readiness for members of the high school graduating class of 2021 who took the ACT, summarized by state. Regional and national summaries for each measure of college readiness are also provided for additional context.
The interactive tool contains multiple views for exploring the data, using the tabs at the top. The "Scores and Benchmarks" tab provides the mean and standard deviation for each ACT test score, the distribution of students across score ranges that align with the ACT College Readiness Standards, and the share of students meeting the respective ACT College Readiness Benchmark. The "Score Distributions" tab provides the number and share of students scoring at each point on the score scale for each ACT test score. The "Group Mean Scores", "Group Score Ranges", and "Group Benchmarks" tabs provide the same summary information found in the "Scores and Benchmarks" tab by various student characteristics. Select a state, ACT test score and student characteristic (if applicable) to get started.
Interpretation of these summary measures of the college readiness of ACT-tested graduates by geographic entity will differ by the number, share, and composition of high school graduates taking the ACT. To assist users with interpretation, the tool also contains comparative information on the number, share, and characteristics of ACT-tested high school graduates. See the "Student Characteristics", "Percent of ACT Natl", "ACT Test Rate", and "Mean Score by Test Rate" tabs for this additional context.
For information about accessing this tool using a keyboard, please see the dashboard help page.
Note: ACT advises discretion when comparing dissimilar populations. Learn about nuances for interpreting the data.
Explore Additional Datasets
- Year-to-Year Average ACT Composite Score Changes
- ACT Composite and ACT Superscore Score Distributions
- Career Pathway Opportunities
- Industry Sector Benchmarks and Wages
- Enrollment, Retention, and Transfer Behaviors